Seaborn 
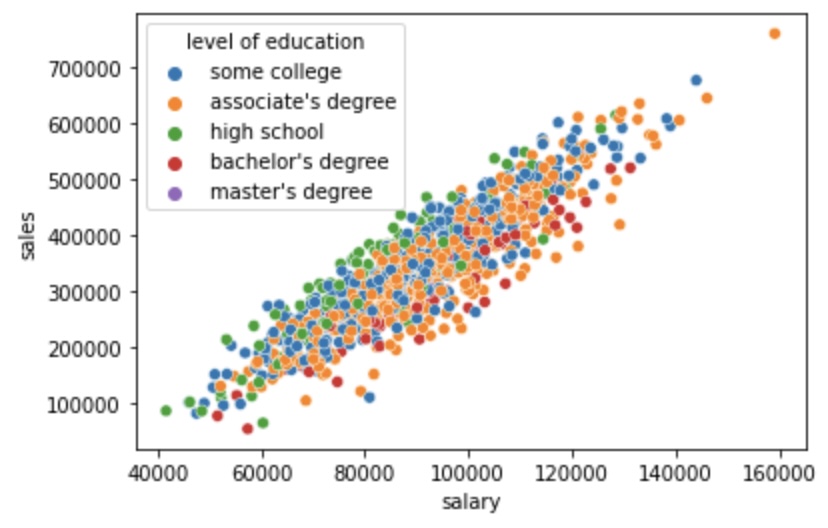
scat = sns.scatterplot(x='A',y='B',data=df,hue='C')
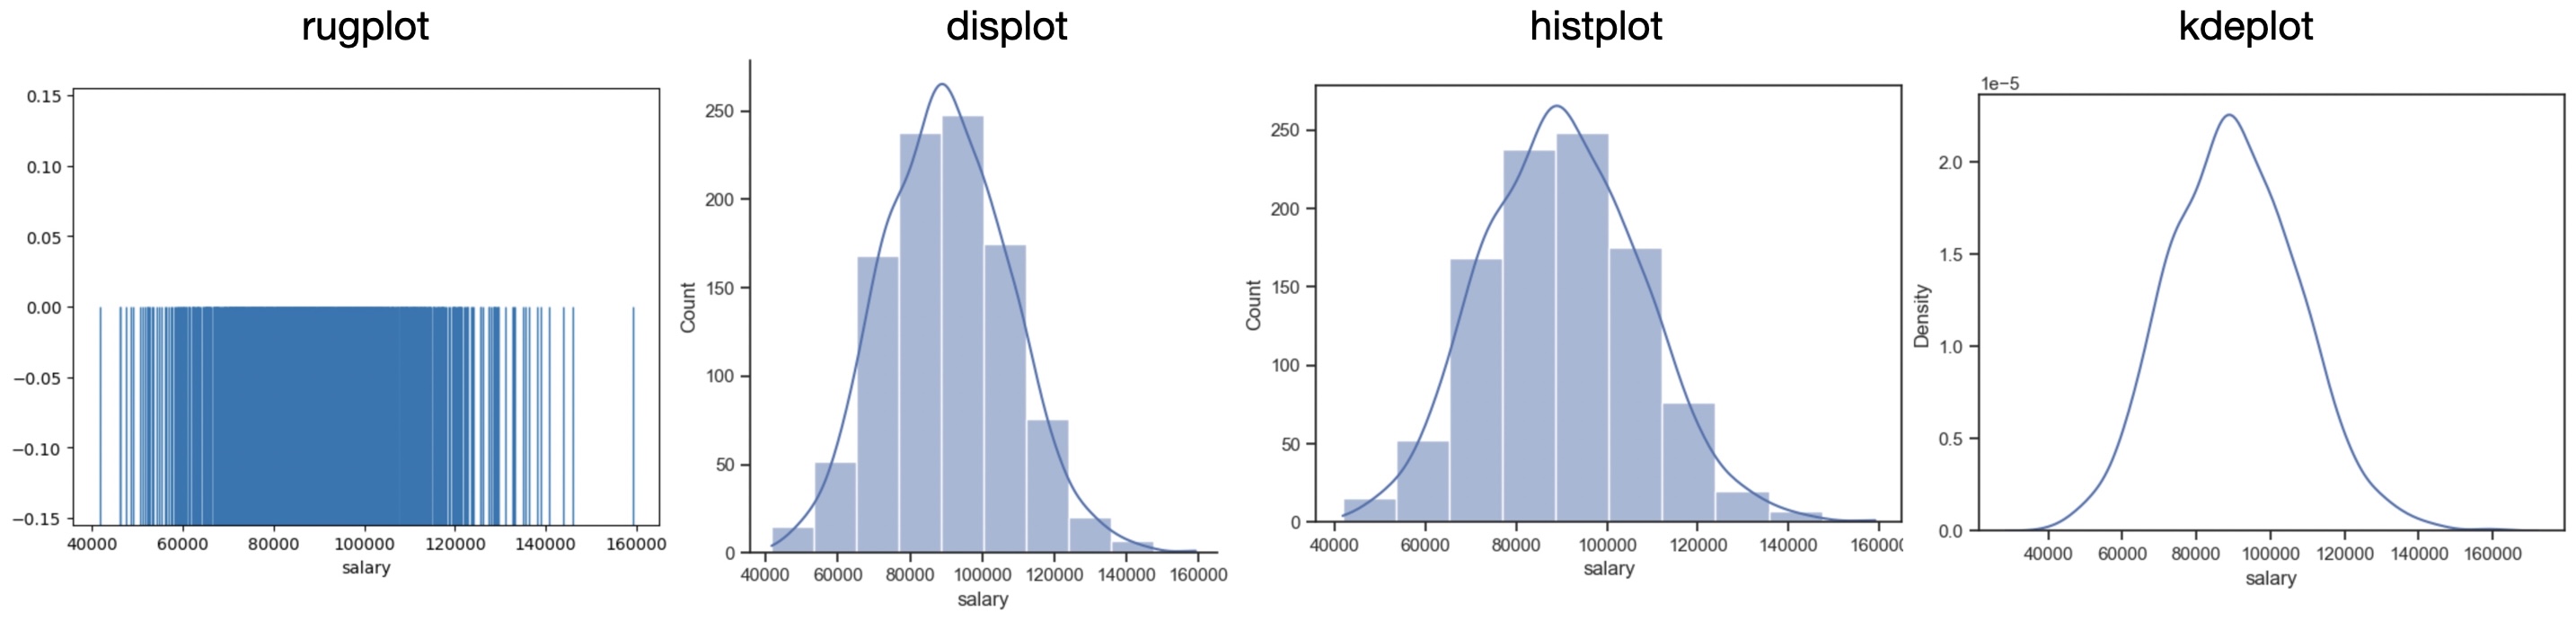
Distribution plots
sns.rugplot(x='A',data=df)
sns.displot(data=df,x='A',bins=20)
sns.histplot(data=df,x='A',bins=20,kde=True)
sns.kdeplot(data=df,x='A')
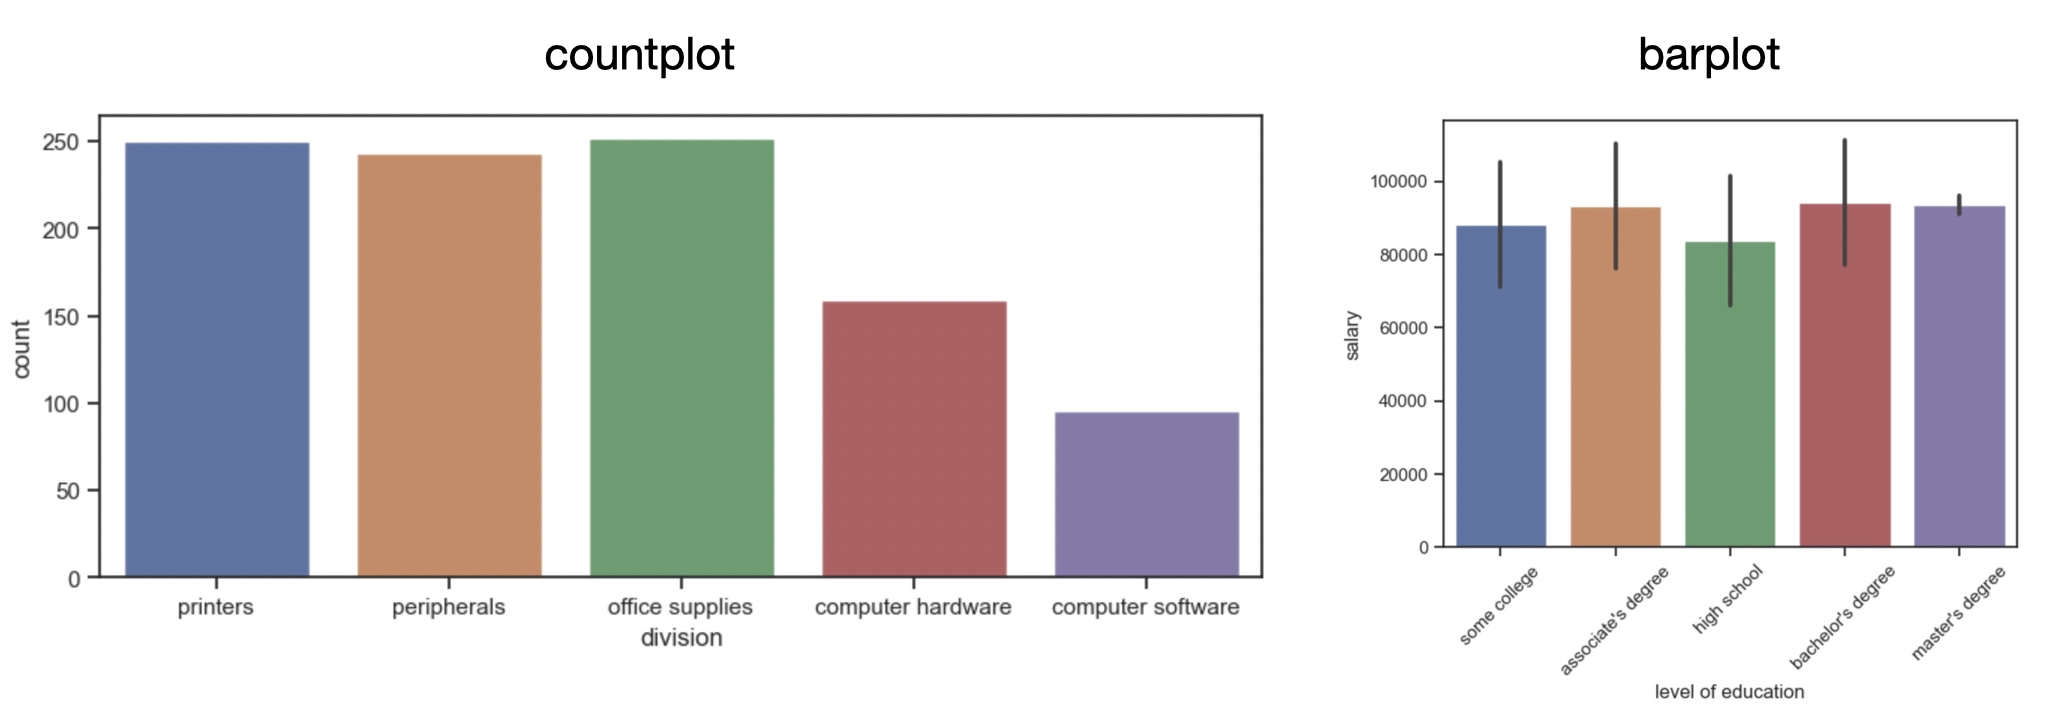
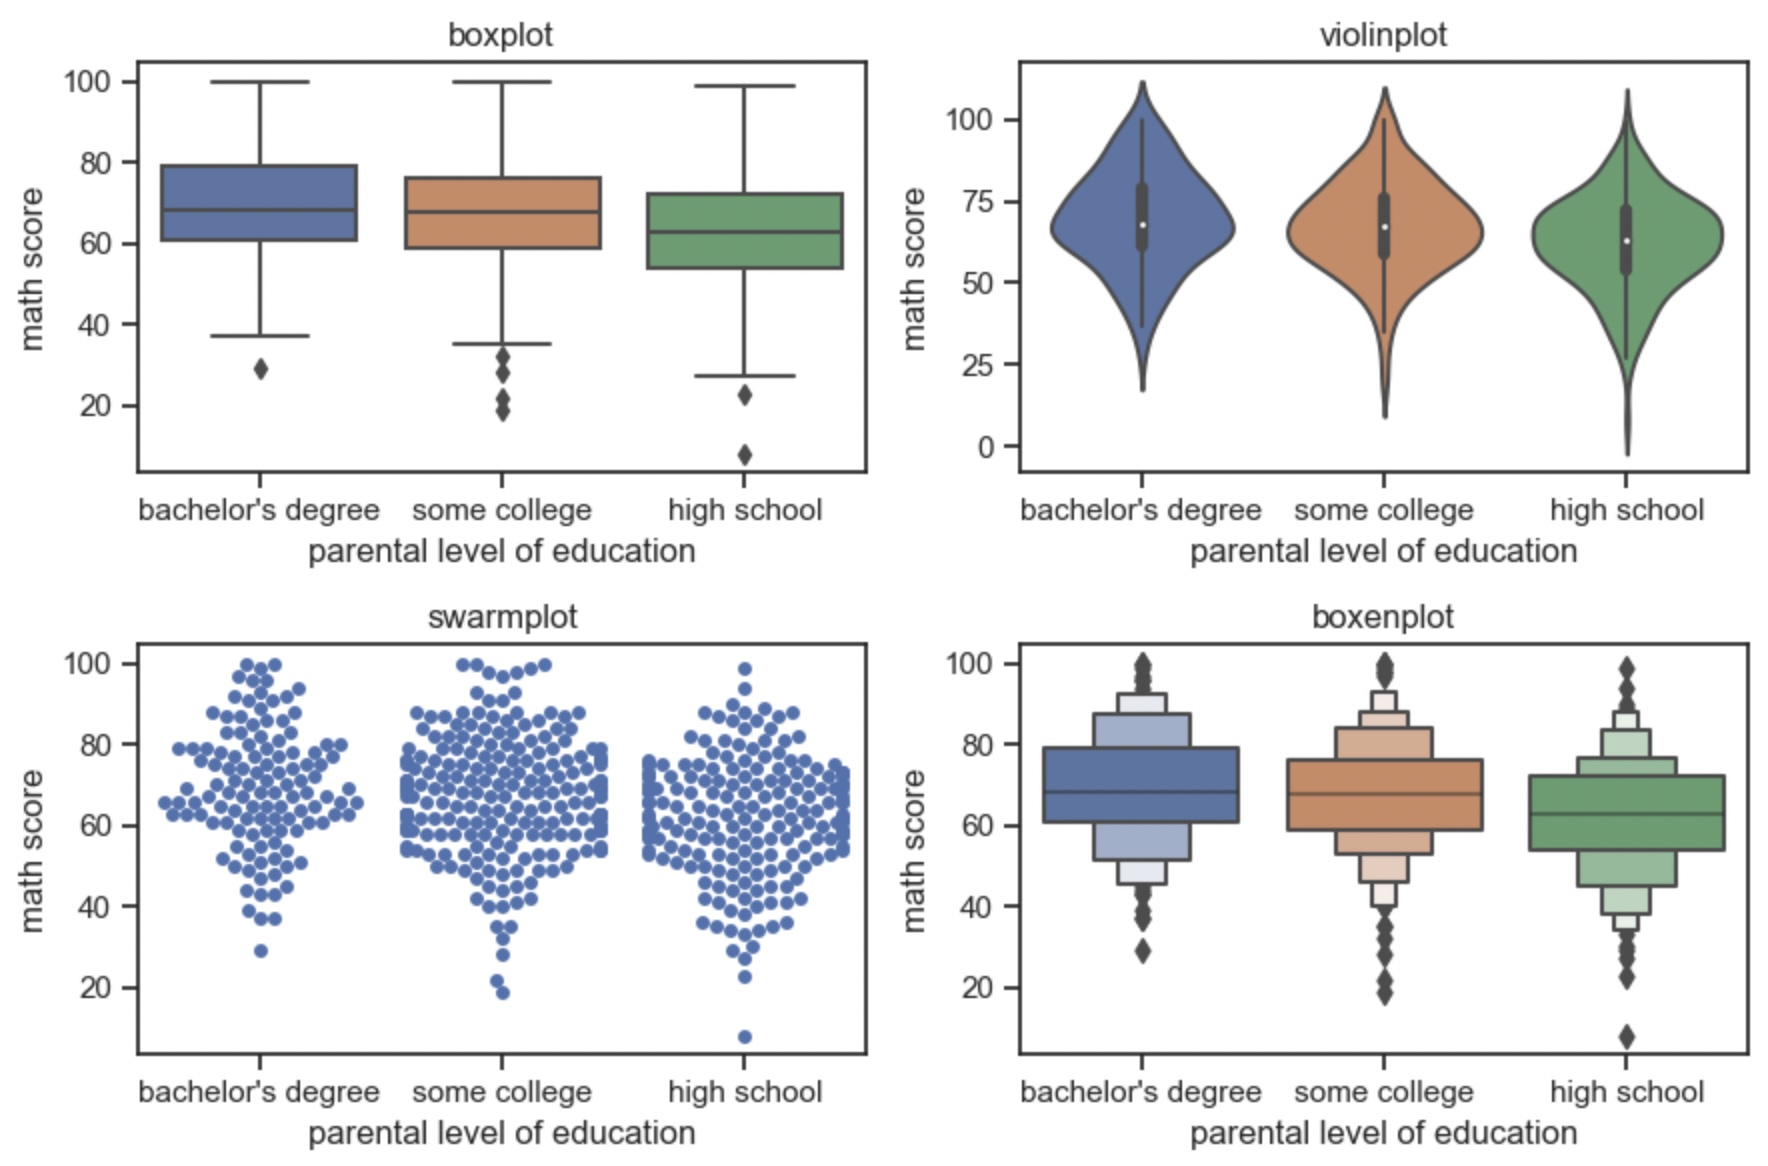
Categorical plots
sns.countplot(data=df,x='A')
sns.barplot(data=df,x='A',y='B',estimator=np.mean,ci='sd')
sns.boxplot(data=df,y='numerical data',x='categories')
sns.violinplot(data=df,y='numerical data',x='categories')
sns.swarmplot(data=df,x='numerical data',y='categories')
sns.boxenplot(data=df,x='numerical data',y='categories')
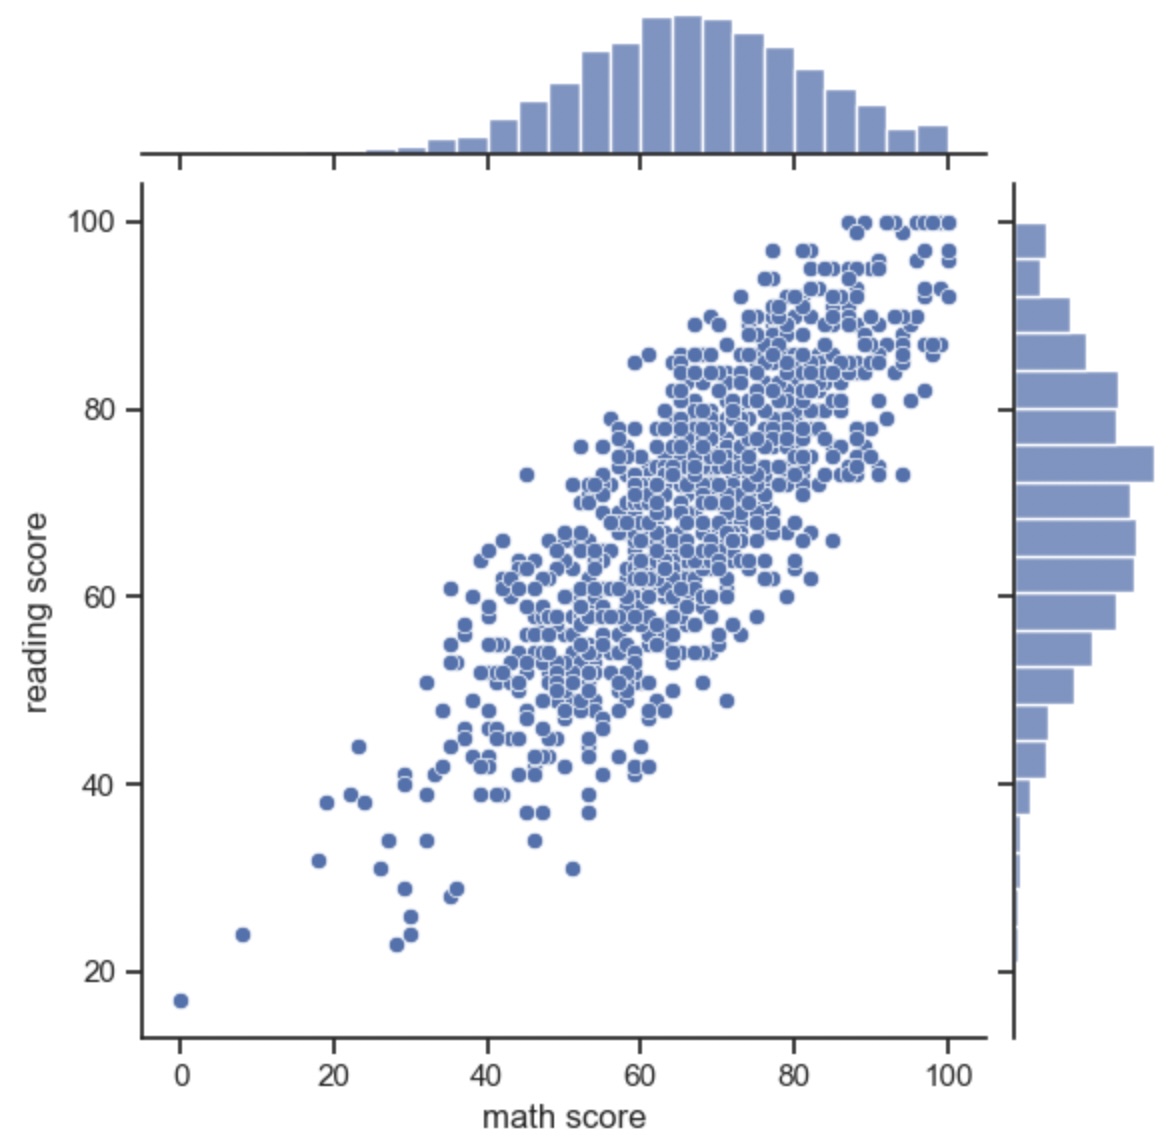
Comparison plots
sns.jointplot(data=df,x='A',y='B',kind='scatter') # or kind hex, hist, kde
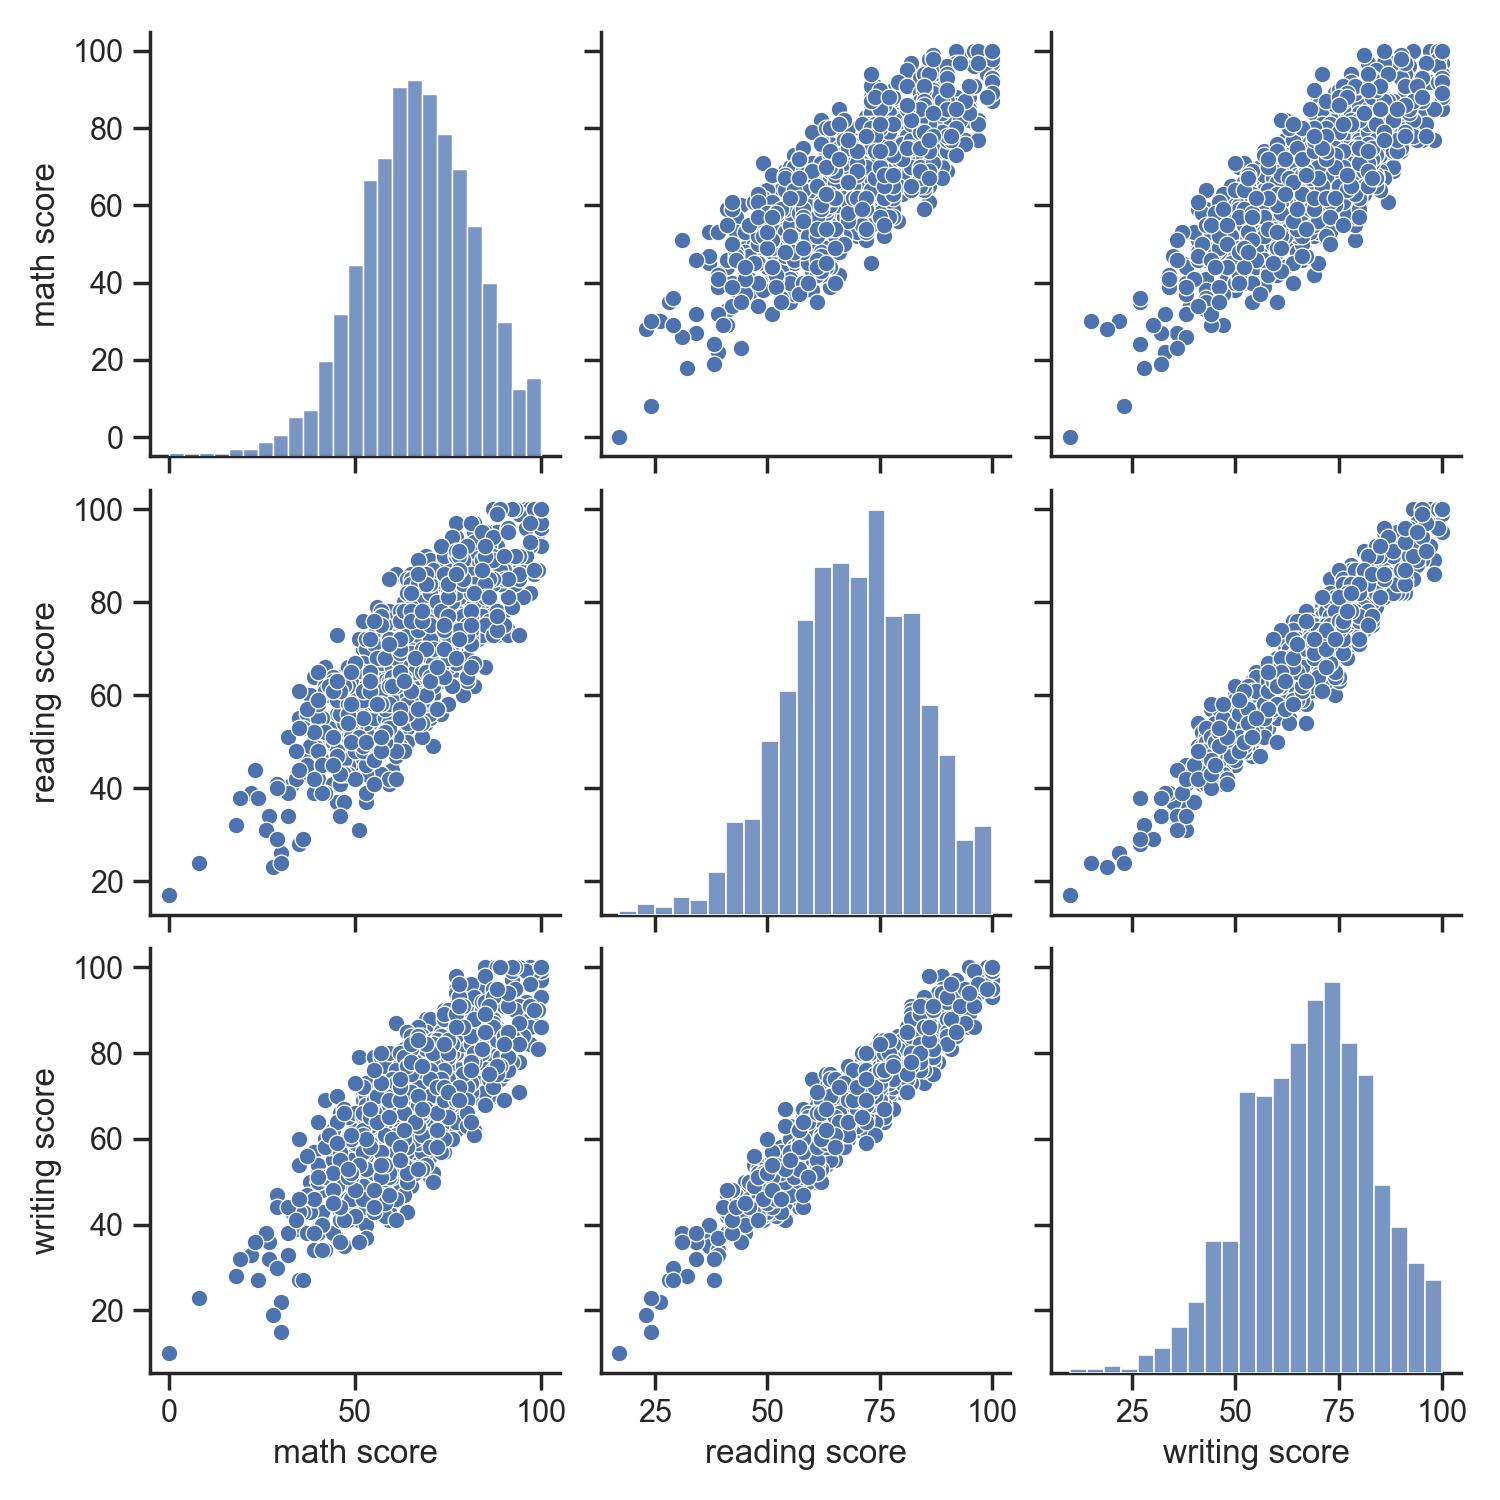
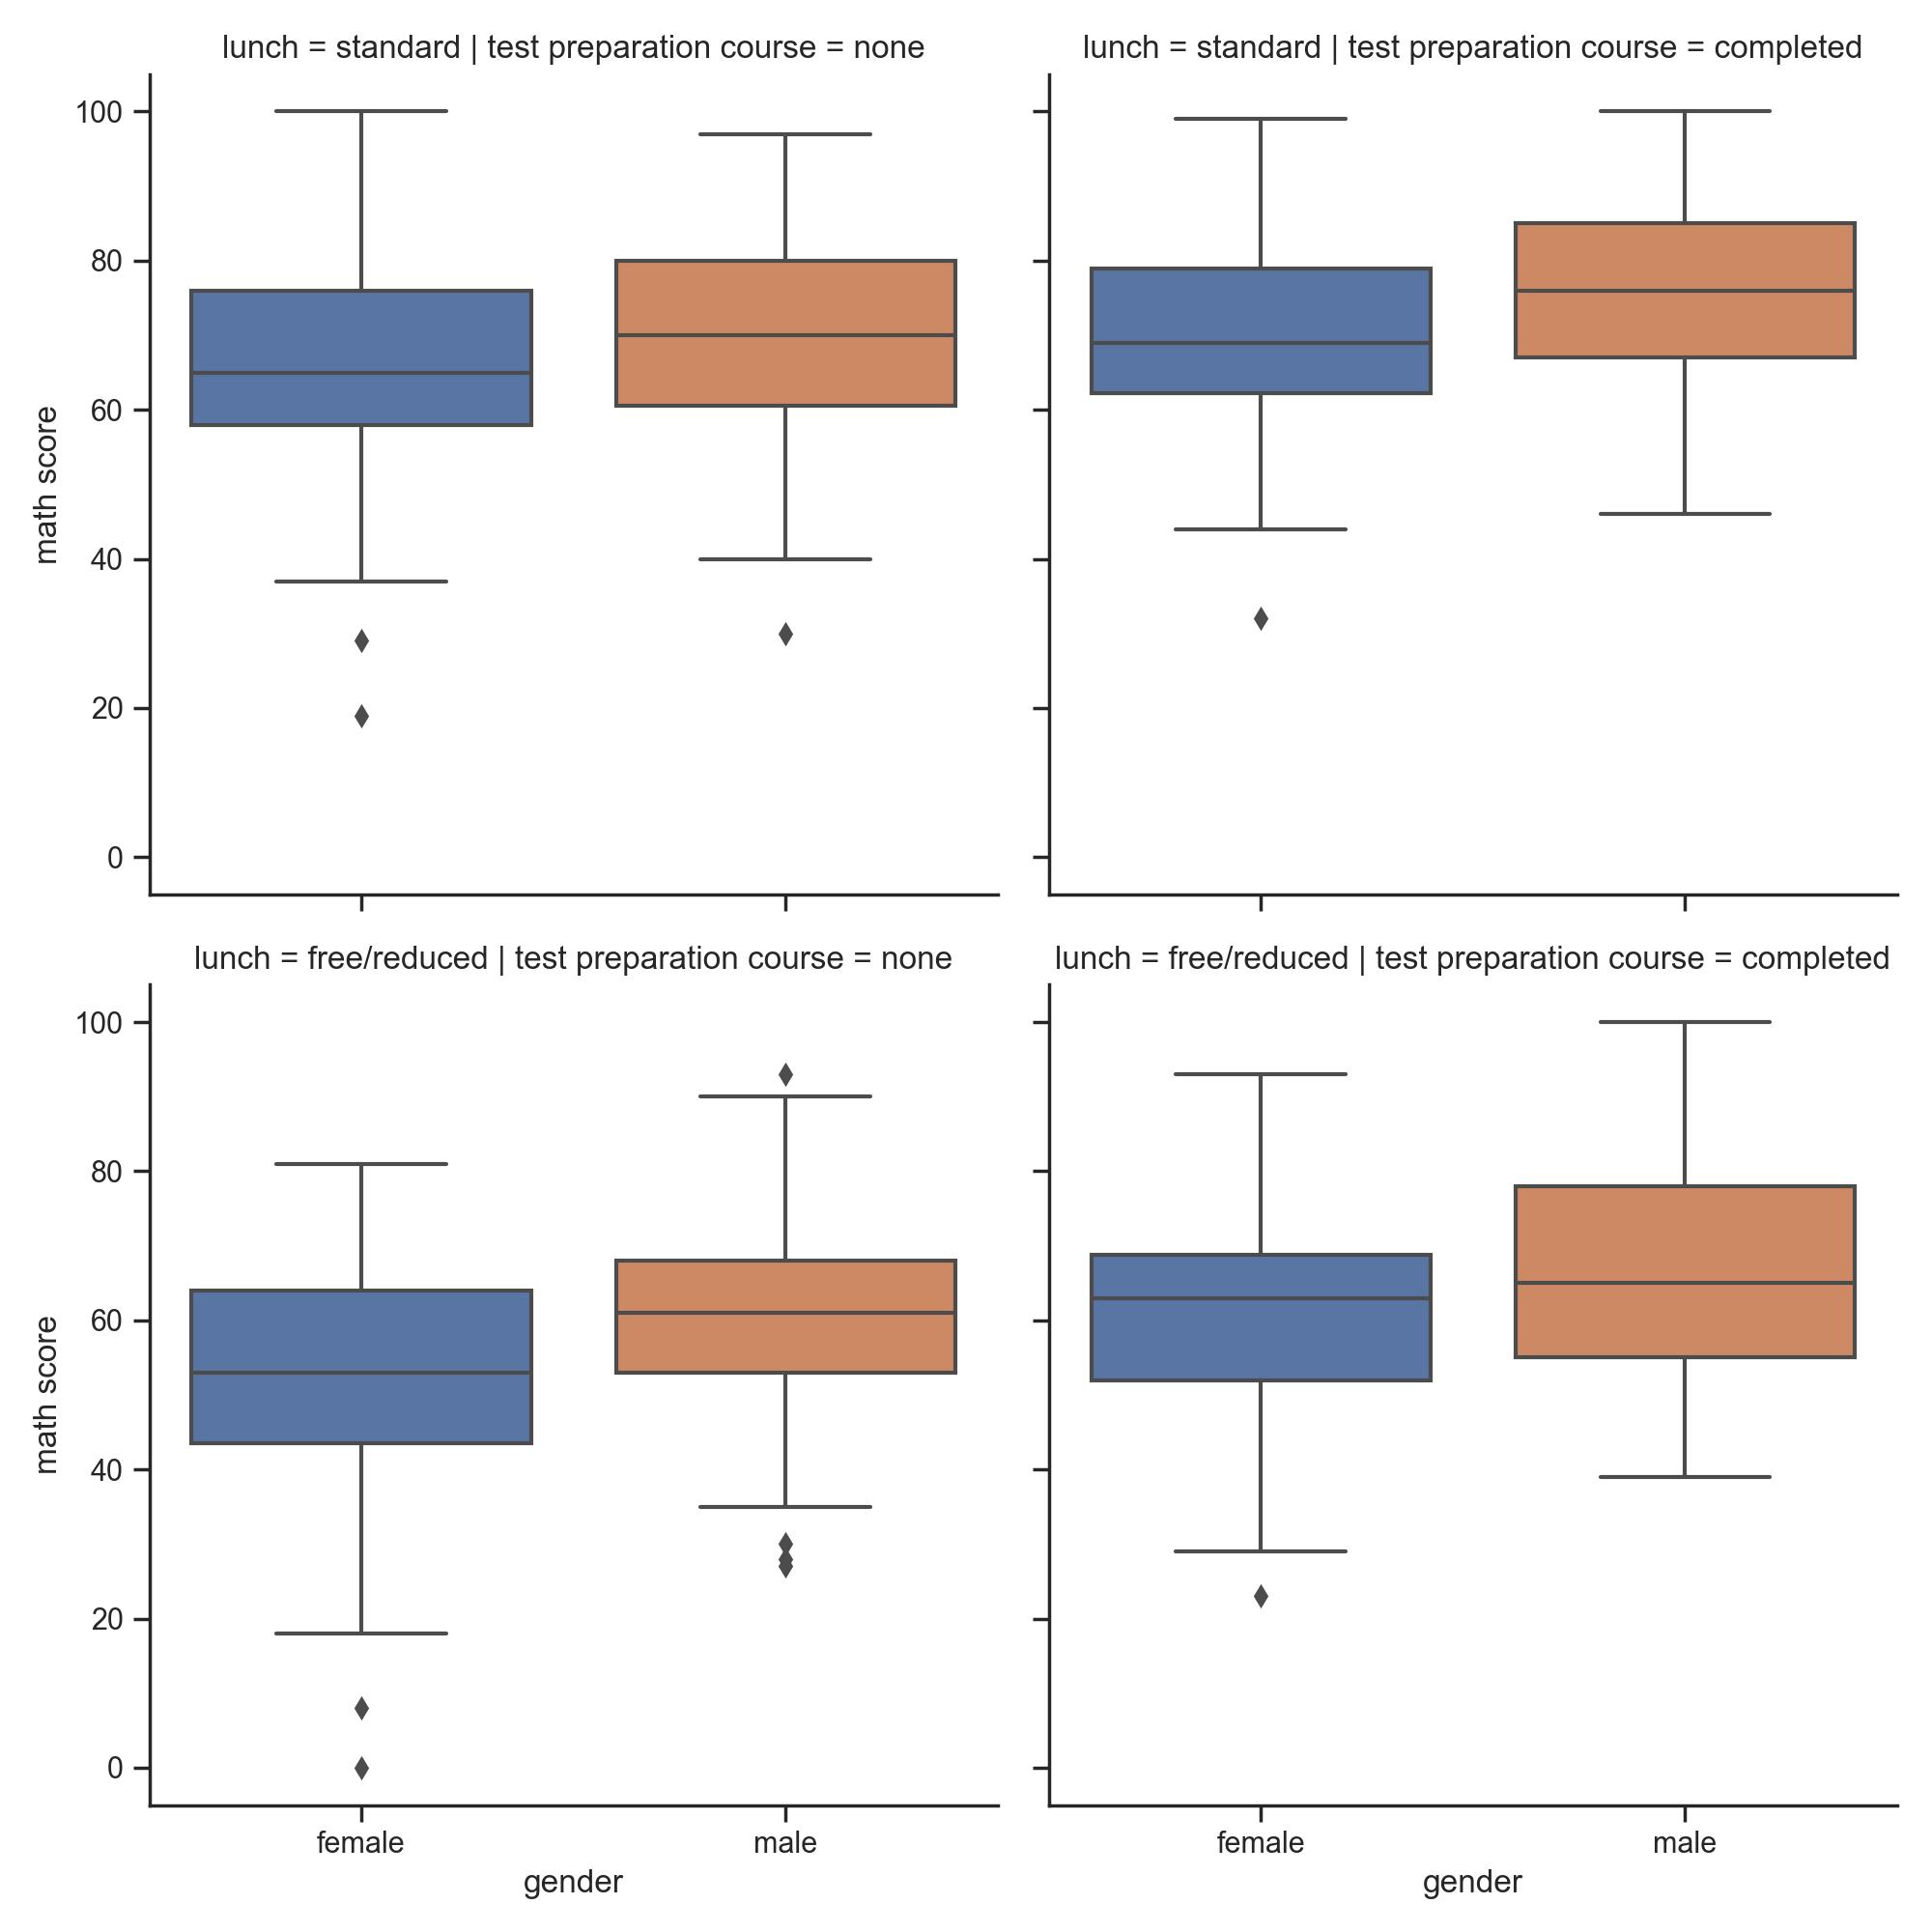
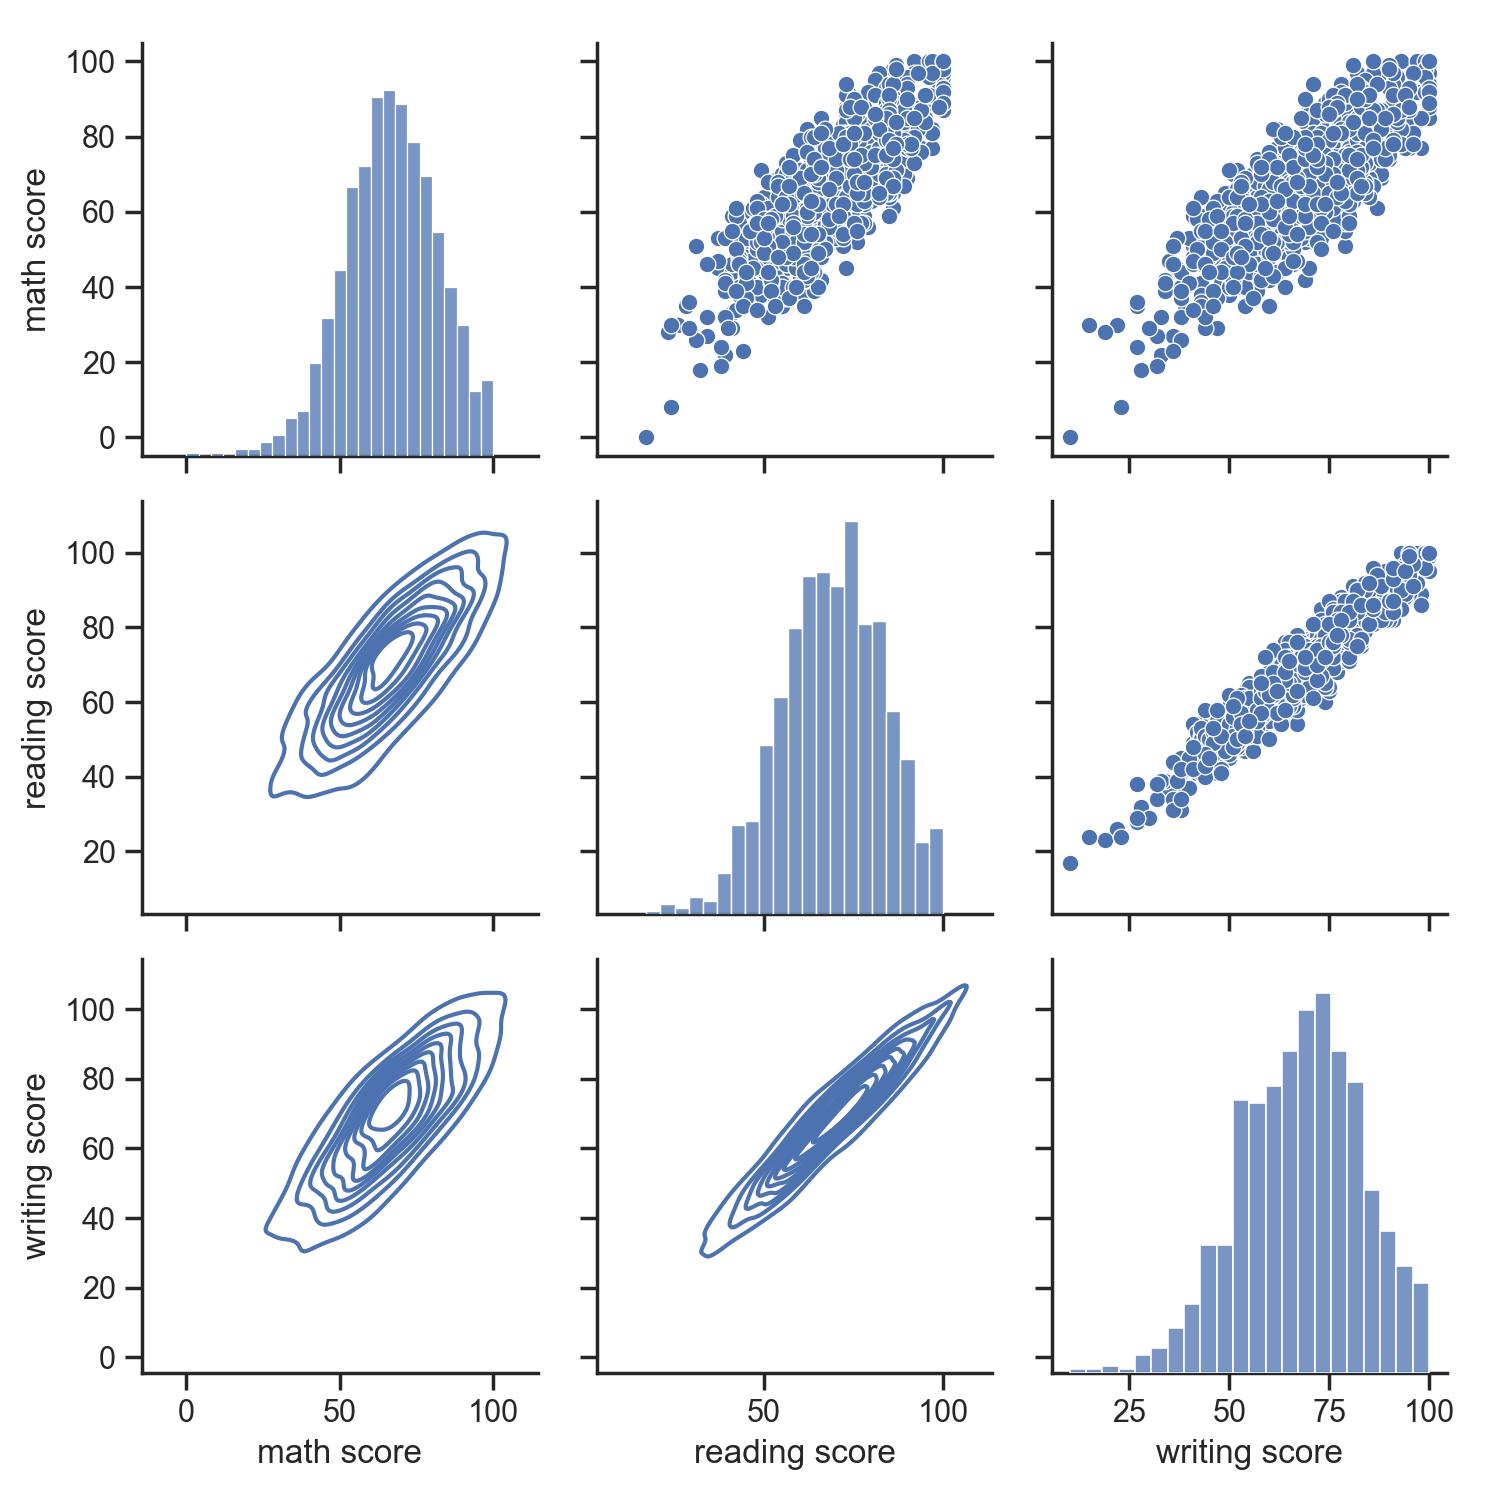
Grid plots
sns.catplot(data=df,x='numerical var',y='cat 1',kind='box',row='cat 2',col='cat 3')
g = sns.PairGrid(df)
g = g.map_upper(sns.scatterplot)
g = g.map_lower(sns.kdeplot)
g = g.map_diag(sns.histplot)
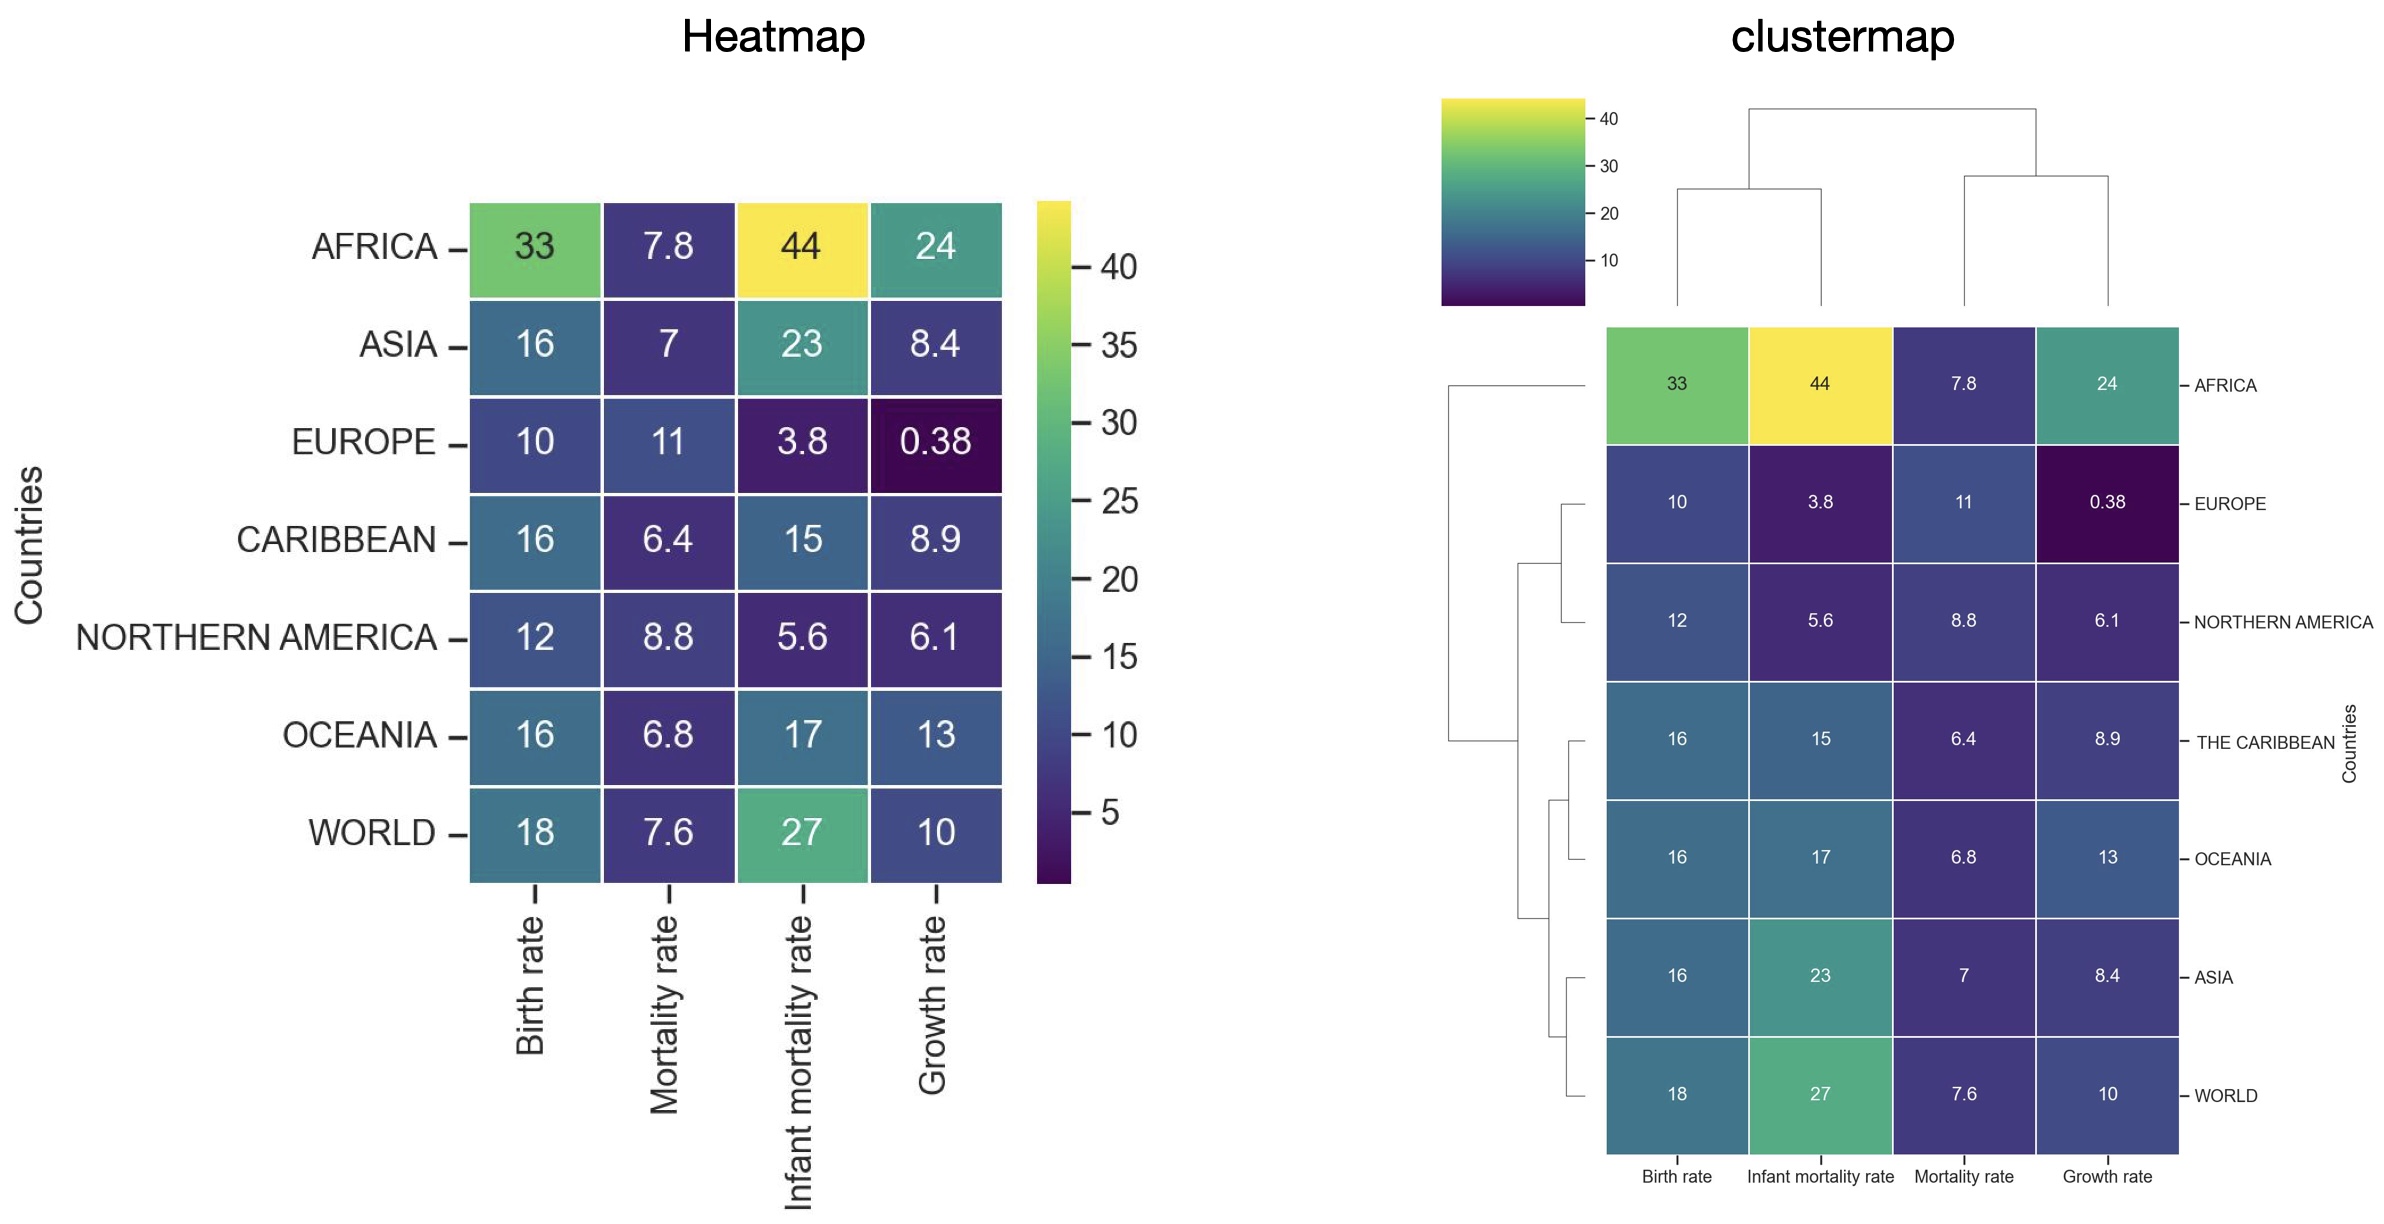
Matrix plots
sns.heatmap(data=df,linewidth=0.5,annot=True, cmap='viridis')
sns.clustermap(data=df,linewidth=0.5,annot=True, cmap='viridis')