DBSCAN
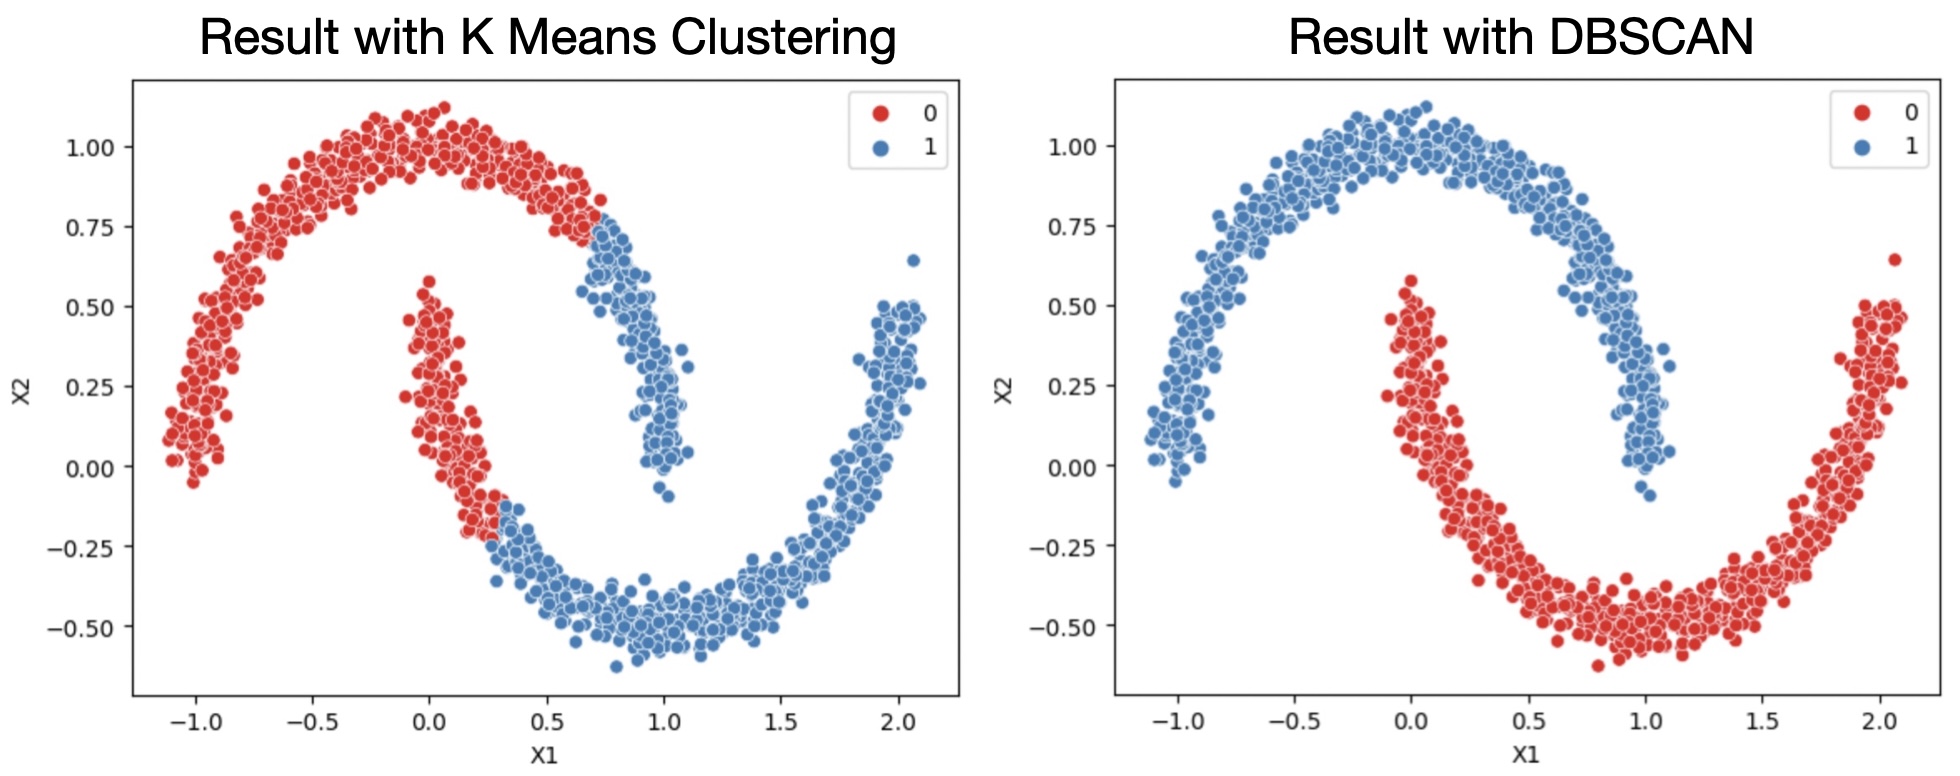
Density based. Very good for non-linearly-separable distributions.
from sklearn.cluster import DBSCAN

model = DBSCAN(eps=0.15)
labels = model.fit_predict(data)

sns.scatterplot(data=data,x='X1',y='X2',hue=labels,palette='Set1')
The eps hyperparameter corresponds to the max distance between two samples for one to be considered as in the neighborhood of the other. This is the most important DBSCAN parameter to choose appropriately for your data set and distance function.
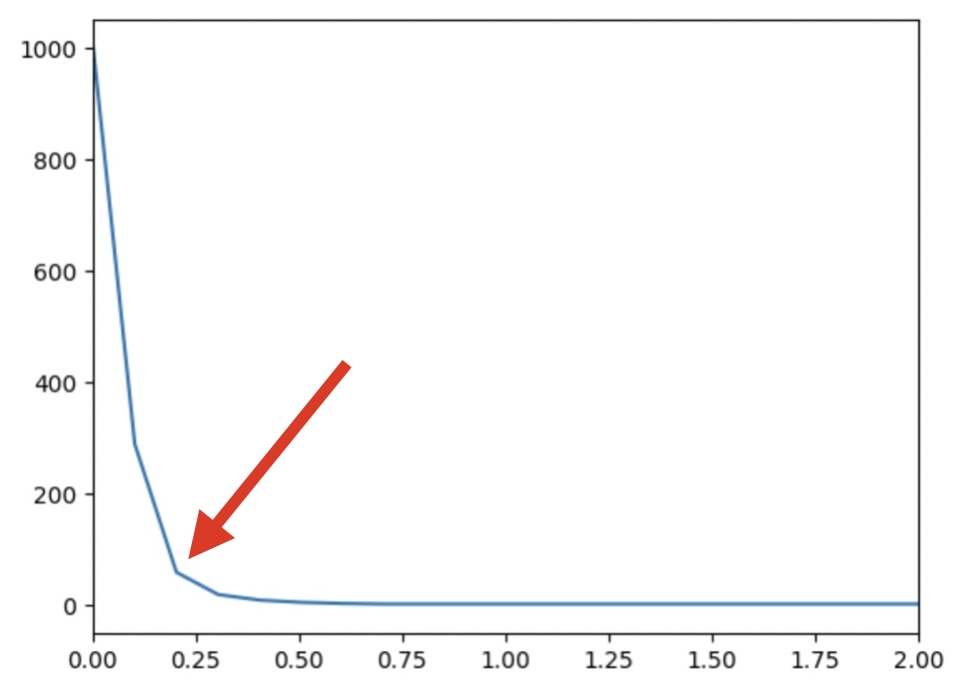
- Embow method to select the eps hyperparameter:
outlier_percent = []
number_of_outliers= []

for eps in np.linspace(0.001,10,100):
    dbscan = DBSCAN(eps=eps)
    dbscan.fit(two_blobs_outliers)

    number_of_outliers.append(np.sum(dbscan.labels_ == -1))
    outlier_percent.append(100 * np.sum(dbscan.labels_ == -1)/len(dbscan.labels_))

sns.lineplot(x=np.linspace(0.001,10,100),y=number_of_outliers)