Profiling python code
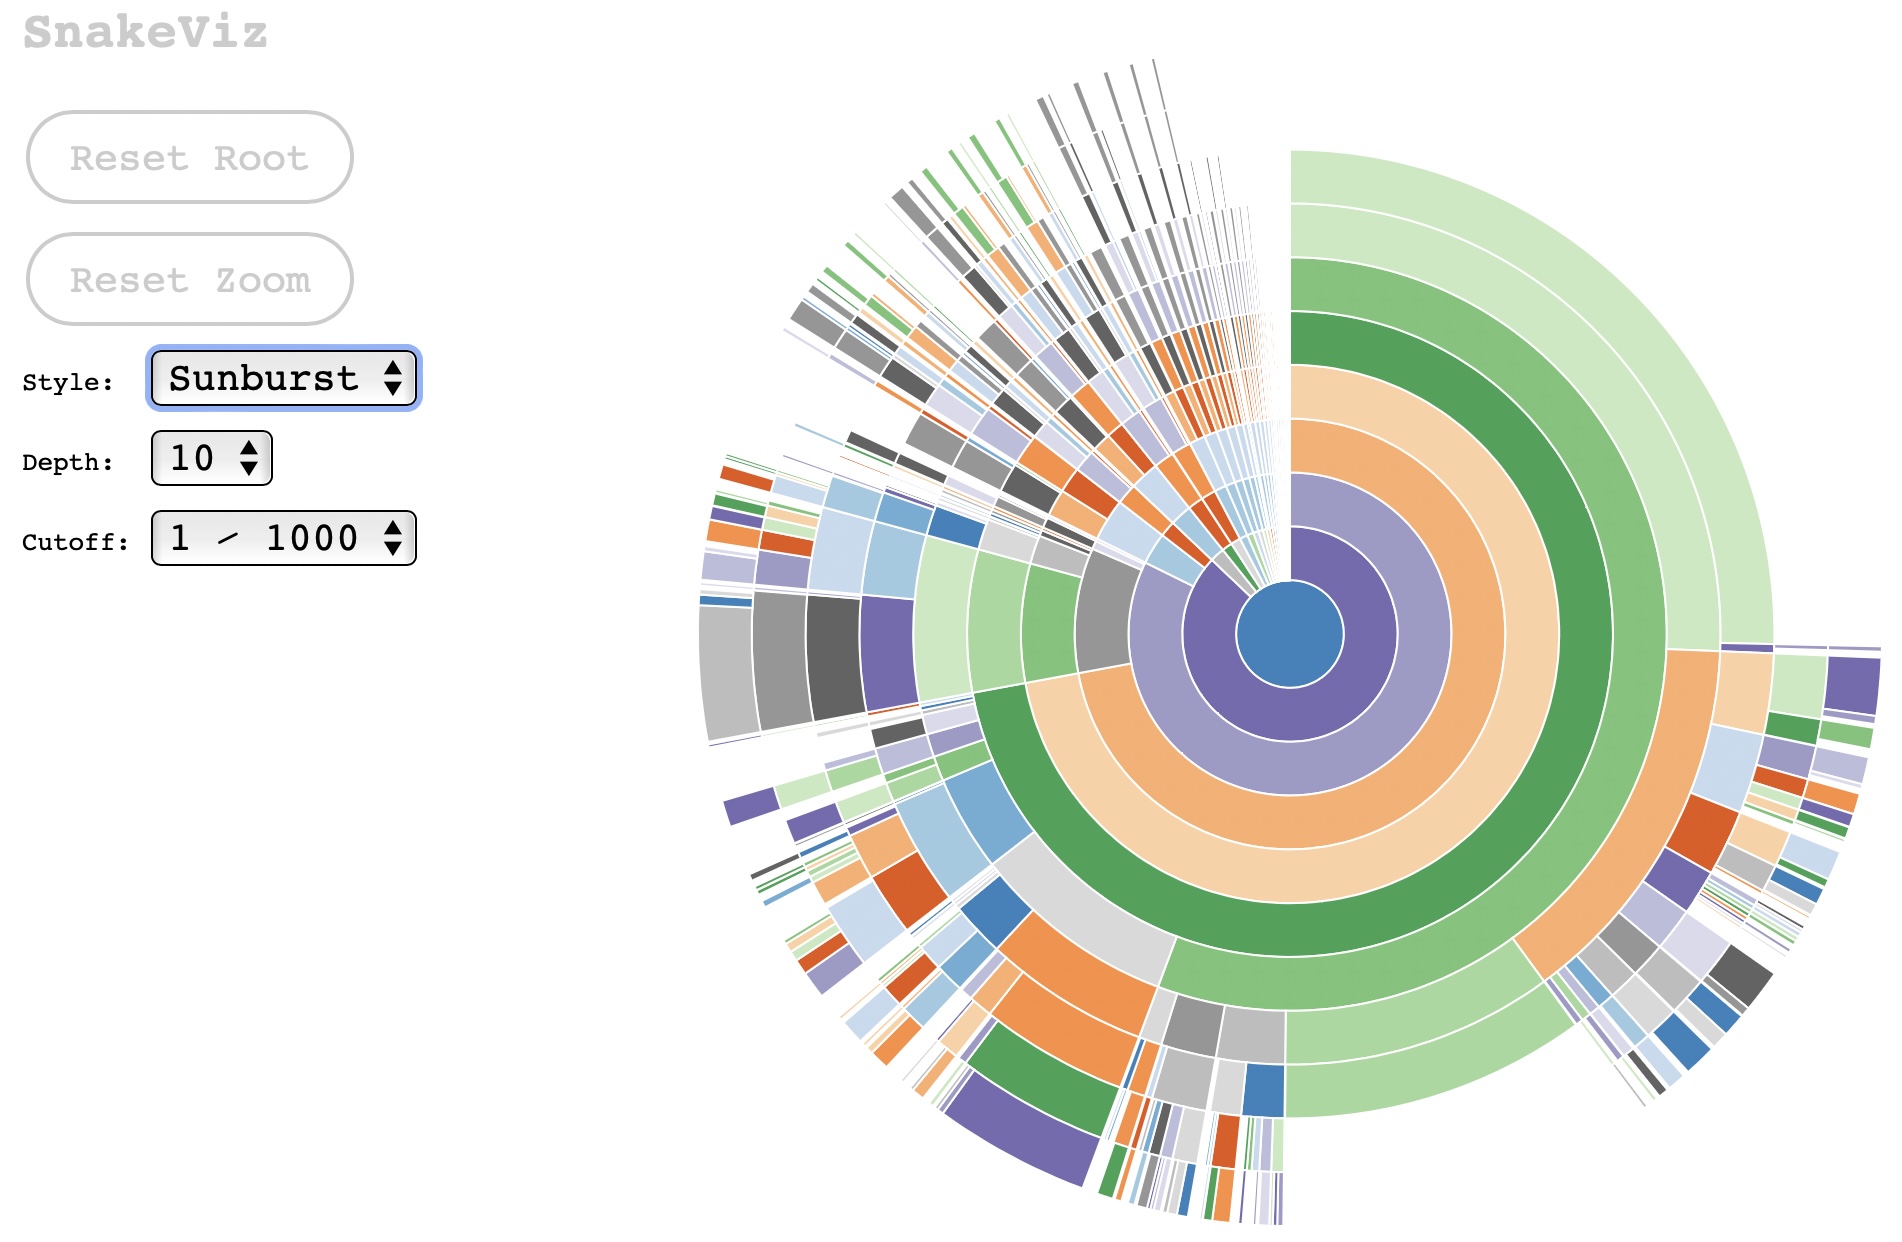
If you run your code nominally as python myscript.py, you can profile this code to see which parts of the code take longer to run by following a couple of simple steps. First, run the code as python -m cProfile -o out.profile myscript.py instead. This produces a file called out.profile. Then, install snakeviz: pip install snakeviz. Finally, run: snakeviz out.profile. This opens a page in your default value with an onion-shell interactive diagram that describes which functions take most of the run time.